This article continues my journey exploring things outside my daily job as a frontend developer — you can read the backstory in how I escaped frontend monotony, and my previous VPS exploration in self-hosting multiple apps on a single VPS with Dokploy.
After getting apps running on my VPS, the next logical question was: what is actually happening inside this machine? Is it running out of memory? Is a container eating all my CPU? Is disk space silently filling up? Without observability, you’re flying blind. This article walks through how I set up a full monitoring stack using Grafana, Prometheus, Node Exporter, and cAdvisor — all running inside Docker.
Basic Concepts
Before we start copying YAML files, let’s understand what each tool does and why we need all of them together.
What is Prometheus?
Prometheus is an open-source monitoring and alerting toolkit originally built at SoundCloud. At its core, it is a time-series database — it stores metrics with timestamps, like “CPU usage was 42% at 14:03:01”.
Prometheus works by scraping (pulling) metrics from target services at a regular interval. Each target exposes a /metrics HTTP endpoint in a text format that Prometheus understands. Prometheus then stores those values and lets you query them using its own query language called PromQL.
Think of Prometheus as the data collector and storage layer. It answers questions like: “Give me the average CPU usage over the last 5 minutes” or “How much memory has this Docker container been using over the past hour?”
What is Grafana?
Grafana is an open-source analytics and visualization platform. On its own, Grafana doesn’t collect or store any data — it is purely a visualization layer. You connect Grafana to a data source (like Prometheus), write queries, and Grafana renders beautiful, interactive dashboards from those results.
The combination makes perfect sense: Prometheus is excellent at collecting and storing time-series metrics, but its built-in UI is minimal and not suited for day-to-day monitoring. Grafana fills that gap with rich dashboards, alerting, and a polished interface. Together, they form the foundation of the modern open-source observability stack.
What are the Exporters?
Prometheus needs something to scrape. Exporters are lightweight agents that expose system or application metrics in the Prometheus format:
- Node Exporter — exposes hardware and OS-level metrics from the host machine: CPU, memory, disk I/O, network traffic, filesystem usage, etc.
- cAdvisor (Container Advisor) — developed by Google, it exposes per-container resource usage and performance metrics: CPU per container, memory per container, network per container, and so on.
With these two exporters, we get full visibility from both the host machine level and the container level.
Prerequisites
- A running VPS (any Linux distro)
- Docker and Docker Compose installed
Set Up Grafana and Prometheus Containers
1. SSH into your VPS
ssh user@your-vps-ip2. Create the monitoring directory and navigate into it
mkdir monitoring && cd monitoring3. Create the docker-compose.yaml file
vim docker-compose.yaml4. Paste the following content
services: prometheus: image: prom/prometheus:latest restart: unless-stopped command: - "--config.file=/etc/prometheus/prometheus.yml" - "--storage.tsdb.path=/prometheus" - "--web.enable-lifecycle" volumes: - ./prometheus.yml:/etc/prometheus/prometheus.yml - prometheus-data:/prometheus
node-exporter: image: prom/node-exporter:latest restart: unless-stopped pid: host volumes: - /proc:/host/proc:ro - /sys:/host/sys:ro - /:/rootfs:ro command: - "--path.procfs=/host/proc" - "--path.sysfs=/host/sys" - "--path.rootfs=/rootfs" - "--collector.filesystem.mount-points-exclude=^/(sys|proc|dev|host|etc)($$|/)"
cadvisor: image: ghcr.io/google/cadvisor:latest privileged: true devices: - /dev/kmsg volumes: - /:/rootfs:ro - /var/run:/var/run:ro - /sys:/sys:ro - /var/lib/docker/:/var/lib/docker:ro - /dev/disk/:/dev/disk:ro restart: unless-stopped
grafana: image: grafana/grafana-enterprise:latest restart: unless-stopped volumes: - grafana-data:/var/lib/grafana depends_on: - prometheus ports: - "3000:3000"
volumes: prometheus-data: {} grafana-data: {}Let’s break down what this file does.
The prometheus service runs the Prometheus server. It is told to load its config from /etc/prometheus/prometheus.yml (which we’ll mount from our local file), store its time-series data at /prometheus (backed by a named Docker volume for persistence), and enable the lifecycle API so you can reload the config without restarting the container.
The node-exporter service exposes the host machine’s system metrics. Notice that it uses pid: host so it can see the host’s process table, and it mounts /proc, /sys, and / from the host in read-only mode. This gives Node Exporter access to real host-level metrics, not just the container’s isolated view. The --collector.filesystem.mount-points-exclude flag filters out irrelevant virtual filesystems so your disk metrics stay clean.
The cadvisor service monitors Docker container metrics. It needs privileged: true and access to /dev/kmsg to properly read kernel-level container metrics. It mounts the Docker socket and various host paths in read-only mode so it can inspect all running containers on the host.
Finally, the grafana service runs the Grafana UI. It depends on Prometheus (so it starts after), stores its configuration and dashboards in a persistent named volume, and exposes port 3000 to the host so you can open it in a browser. Notice that Prometheus and the exporters do not expose ports to the host — they only communicate internally over Docker’s network, which is a sensible security default.
5. Create the prometheus.yml configuration file
vim prometheus.ymlPaste the following:
global: scrape_interval: 15s
scrape_configs: - job_name: "prometheus" static_configs: - targets: ["localhost:9090"]
- job_name: "node" static_configs: - targets: ["node-exporter:9100"]
- job_name: "cadvisor" static_configs: - targets: ["cadvisor:8080"]Let’s walk through what this configuration does.
The scrape_interval: 15s at the global level tells Prometheus to poll every target every 15 seconds. This is the default for all jobs, though individual jobs can override it. 15 seconds is a good balance between metric resolution and storage cost.
For the scrape jobs, Prometheus first scrapes itself via the prometheus job at localhost:9090, which exposes its own internal metrics like scrape counts and memory usage. The node job points to node-exporter:9100 to collect host machine metrics, and the cadvisor job points to cadvisor:8080 for container-level metrics. Notice that both use the Docker Compose service name as the hostname — Docker’s internal DNS resolves these names automatically within the same Compose network, so no hardcoded IP addresses are needed.
6. Start the stack
docker compose up -dDocker will pull all the images and start all four containers in the background. You can verify everything is running with:
docker compose psOnce it’s up, visit http://<your-vps-ip>:3000 in your browser to access the Grafana dashboard. The default login credentials are admin / admin — Grafana will prompt you to change the password on first login.
Connect Prometheus as a Grafana Data Source
Before we can build any dashboards, we need to tell Grafana where to get its data.
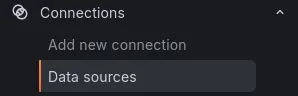
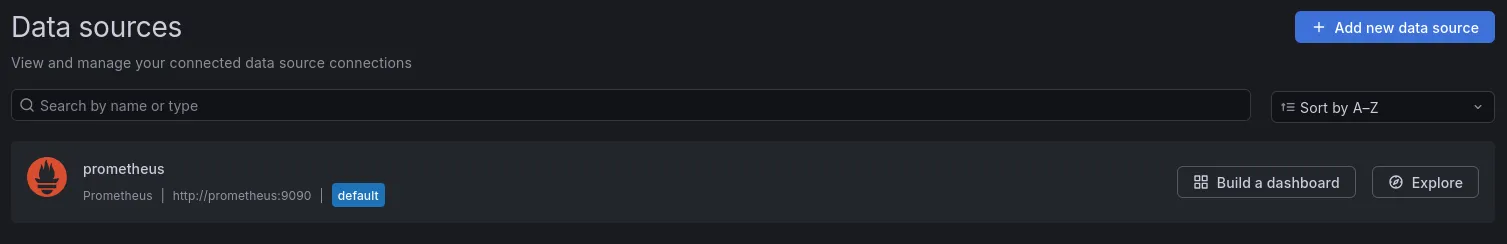
- In the Grafana sidebar, go to Connections → Data Sources
- Click Add new data source
- Select Prometheus from the list
On the configuration page, find the Connection section and set the Prometheus server URL to: http://prometheus:9090.
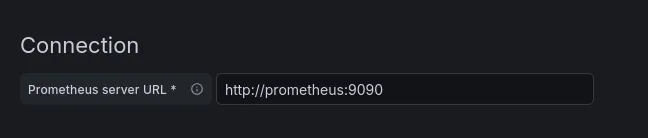
We use the Docker service name prometheus here instead of localhost, because from Grafana’s perspective inside Docker, localhost refers to the Grafana container itself — not the Prometheus container. Docker’s internal network handles the resolution correctly using the service name.
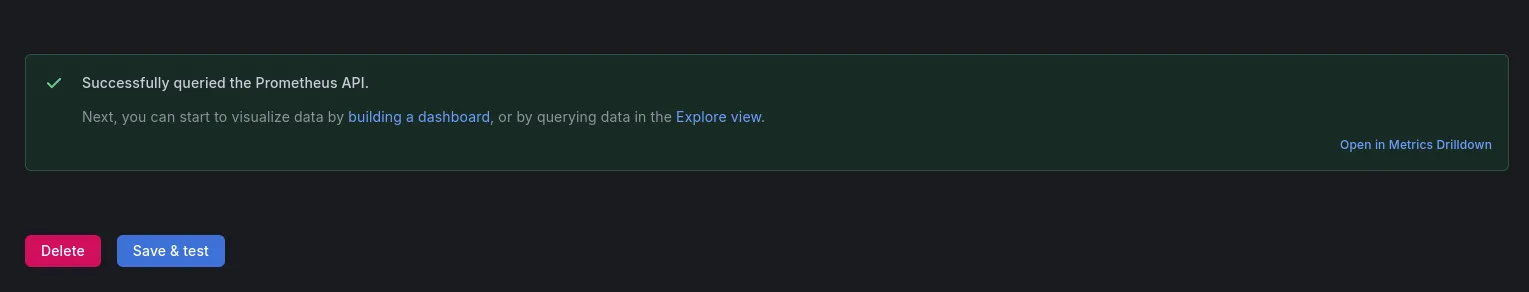
Scroll to the bottom and click Save & Test. If everything is wired up correctly, you’ll see a green success banner confirming the connection. Grafana can now query Prometheus for metrics.
Create Grafana Dashboards
With the data source connected, it’s time to set up dashboards. The good news: you don’t need to build them from scratch. Grafana has a rich library of community-made dashboards at grafana.com/grafana/dashboards that you can import with a single ID.
Since we’re using Node Exporter and cAdvisor, we’ll import dashboards designed for those exporters.
Import a Dashboard
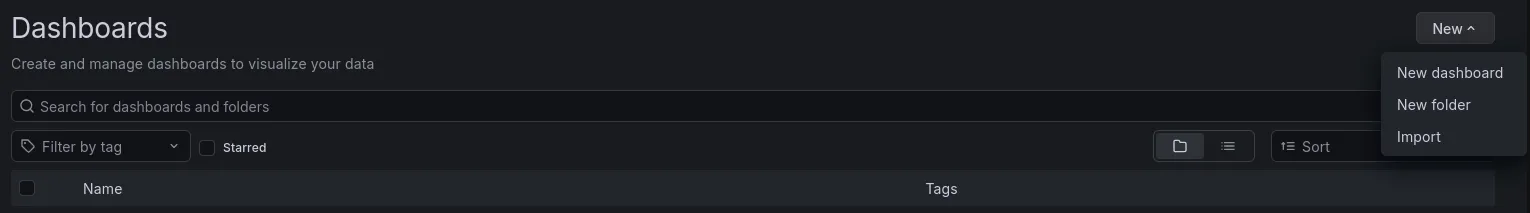
Go to Dashboards → New → Import. Grafana gives you three ways to import a dashboard:
Option 1: Import via Grafana ID This is the quickest method. Enter the dashboard ID in the “Import via grafana.com” field and click Load. Grafana will fetch the dashboard definition directly from the community library. On the next screen, select your Prometheus data source from the dropdown, then click Import.
Option 2: Paste JSON If you’ve already copied the dashboard’s JSON definition — for example, from the Grafana dashboard page by clicking “Download JSON” — you can paste it directly into the “Import via panel json” text area and click Load. This is useful when you’re working on a server with restricted outbound internet access and can’t reach grafana.com directly.
Option 3: Upload JSON file
If you have the dashboard saved as a .json file on your local machine, click “Upload dashboard JSON file” and select the file. Grafana will parse it and walk you through the same import confirmation screen. This comes in handy when sharing custom or modified dashboards between team members or environments.
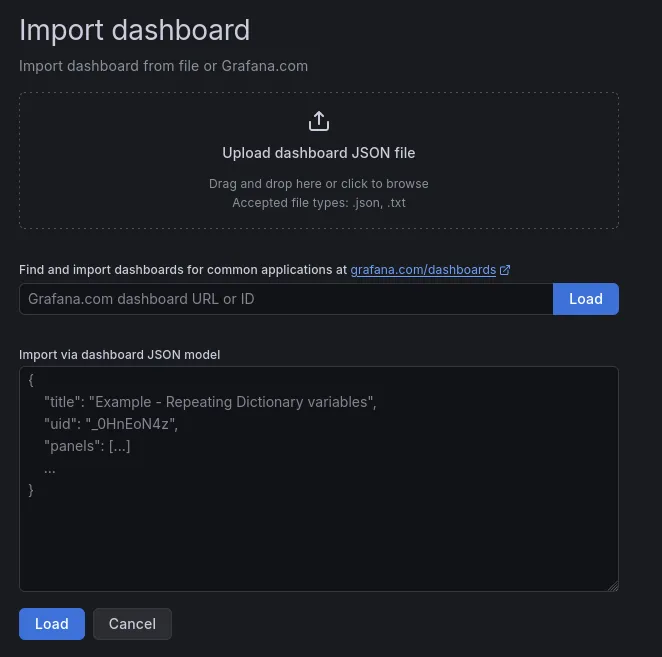
All three options lead to the same result — pick whichever fits your workflow.
Recommended Dashboards
Node Exporter Full — Dashboard ID: 1860
grafana.com/grafana/dashboards/1860
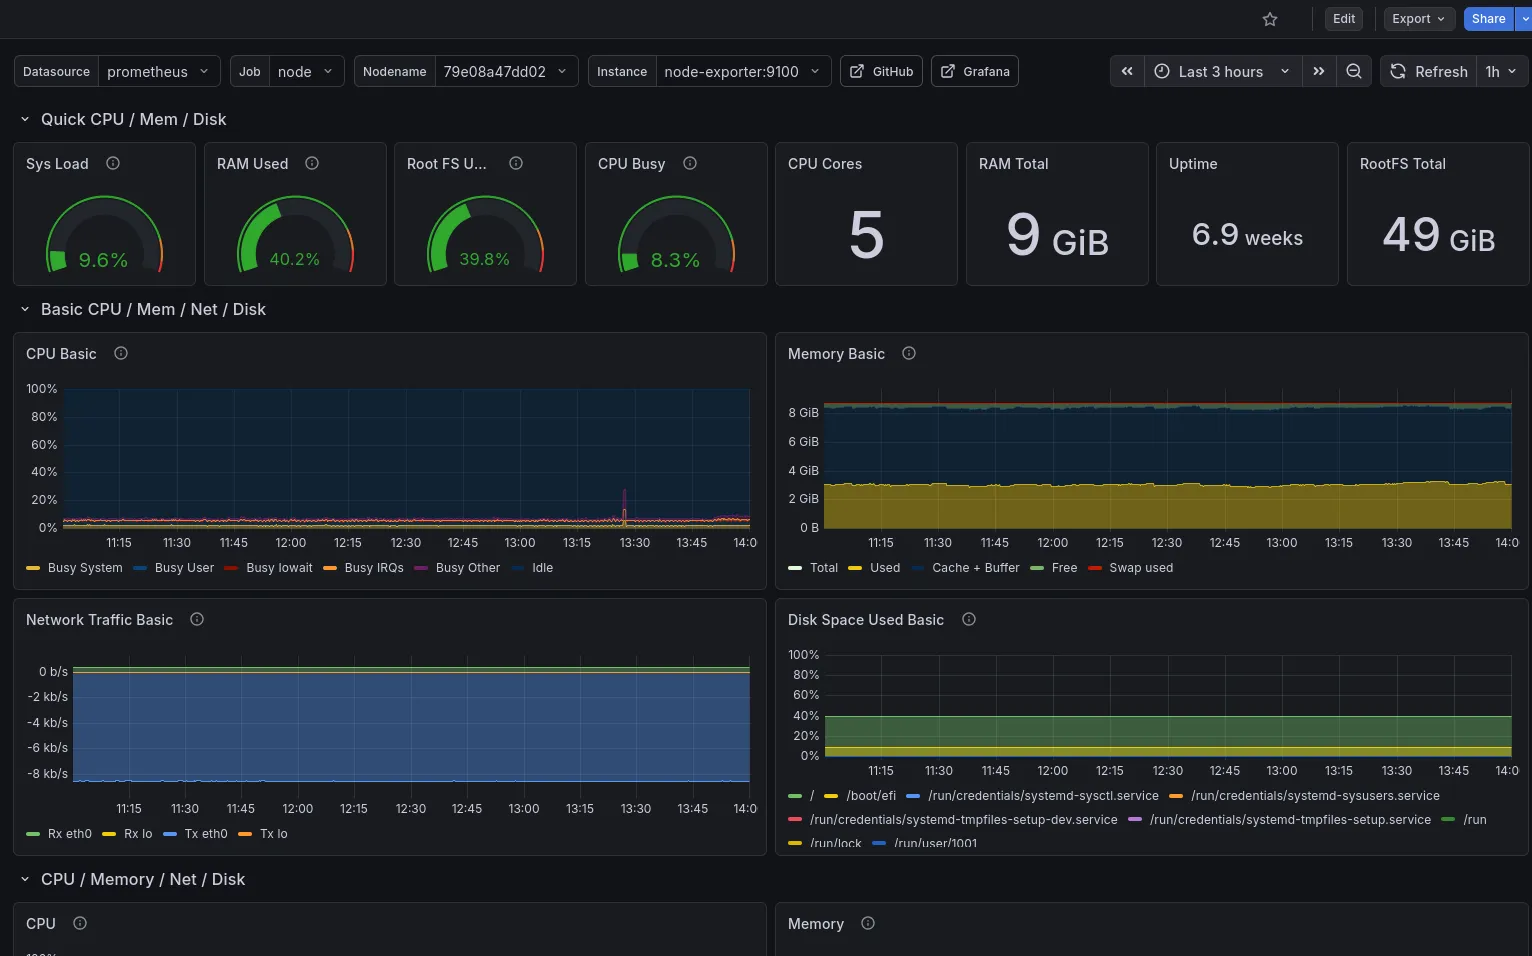
This is one of the most popular dashboards in the Grafana library. It gives you a comprehensive view of your host machine: CPU usage and temperature, memory and swap, disk I/O, network throughput, filesystem usage, and much more — all in a single, well-organized dashboard.
cAdvisor Exporter — Dashboard ID: 19724
grafana.com/grafana/dashboards/19724
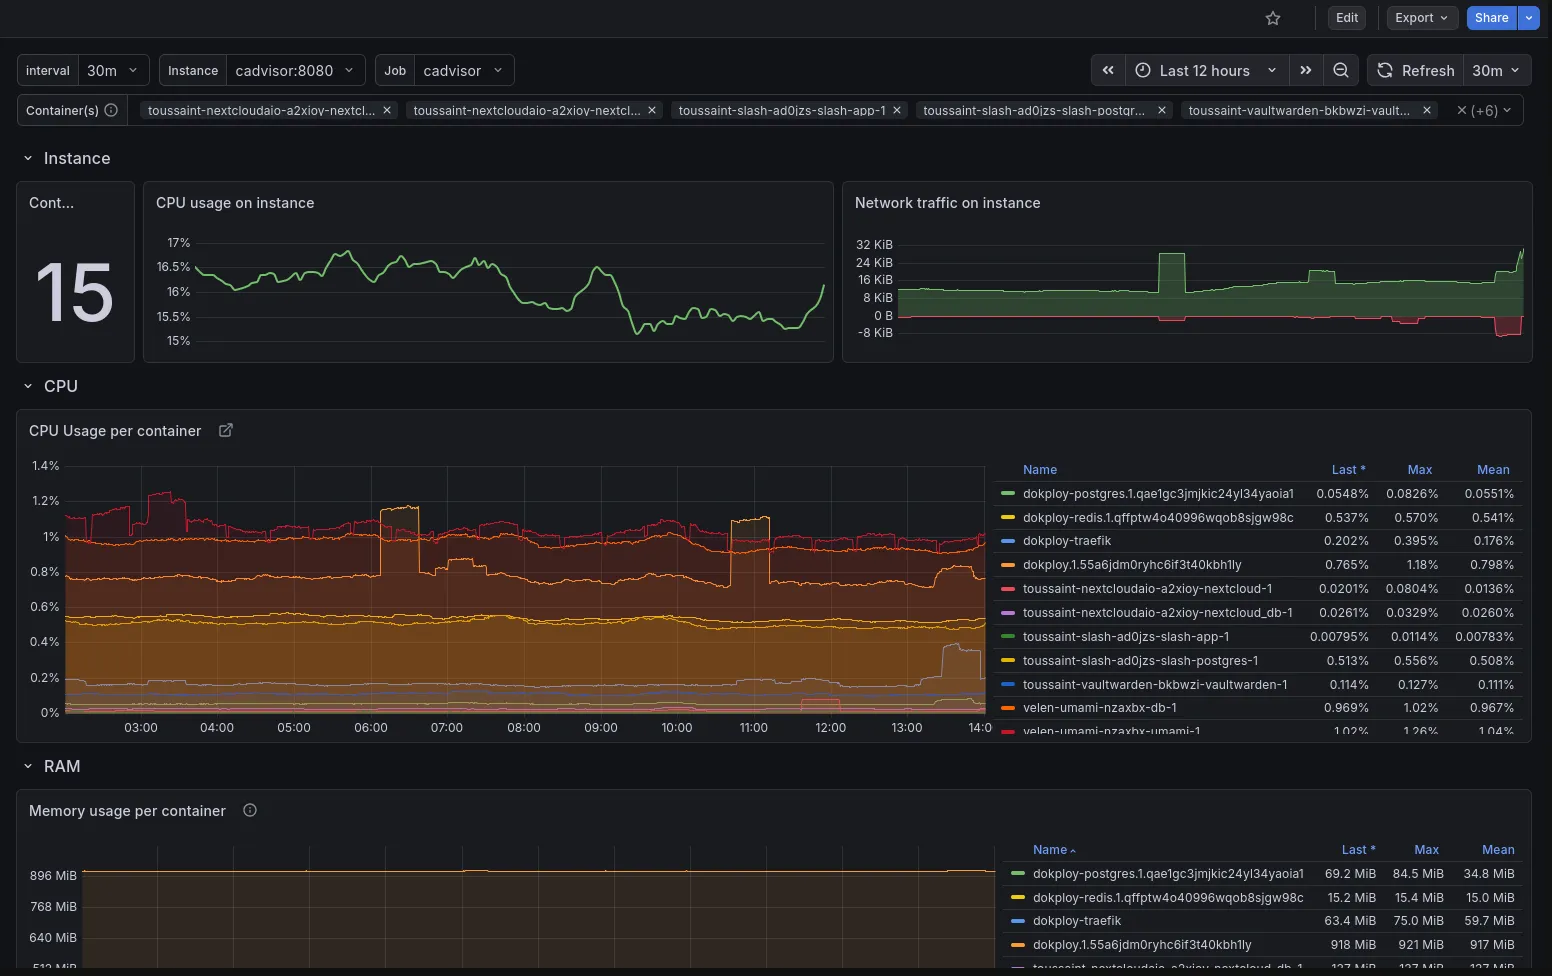
This dashboard visualizes per-container metrics: which containers are running, their CPU and memory consumption, network I/O, and filesystem usage. It’s invaluable for understanding how individual services are behaving on your VPS.
After importing both, you’ll have a full-featured monitoring setup without writing a single PromQL query yourself.
Wrapping Up
In just a few steps, we now have an observability stack running on the VPS: Prometheus collecting and storing metrics every 15 seconds, Node Exporter surfacing host-level system data, cAdvisor reporting per-container resource usage, and Grafana pulling it all together into clean, interactive dashboards.
From here, you can go further — customize the dashboards by editing panels, adding filters, or removing charts you don’t need. You can also explore Grafana’s alerting system to get notified (via email, Slack, or webhook) when a metric crosses a threshold, like memory usage going above 90%.
Observability transformed how I think about my VPS. Instead of SSHing in and running htop reactively when something feels slow, I now have a persistent, historical view of how the machine behaves — which makes diagnosing problems and planning capacity a lot more intentional.